Summary
This topic will act as a draft and basis to an article covering the work that Greg Byers ( @ByersGuitars) and I did in 2014. The aim of the "research" was to collect, both objective and subjective, data to deepen the understanding in how different construction parameters such as bracing systems, top, back and side thickness impacts the modes of vibration and sound characteristics of the guitar. Also, we further tried to cover the interaction between top and back plate. The full article will later be published on ProGuitar.
Thanks to Greg's experimental guitars we were able to make measurements on over 100 different combinations of bracing systems, back, side and top thicknesses. Most of the measured results verified the well known science in the field but we also found new interesting acoustic behaviours, to my knowledge, not earlier explained.
Top plates
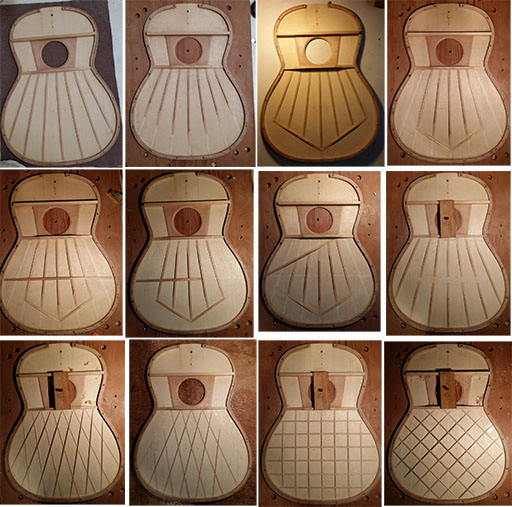
The experiment consisted of 6 (3 pairs of) top plates with the thickness of 1.5mm, 2.2mm and 3.0mm.
Type of wood:
Top plate: Spruce (Picea Engelmanni)
Bridge: Rosewood (Dalbergia maritima)
Bracing systems:
Back plates
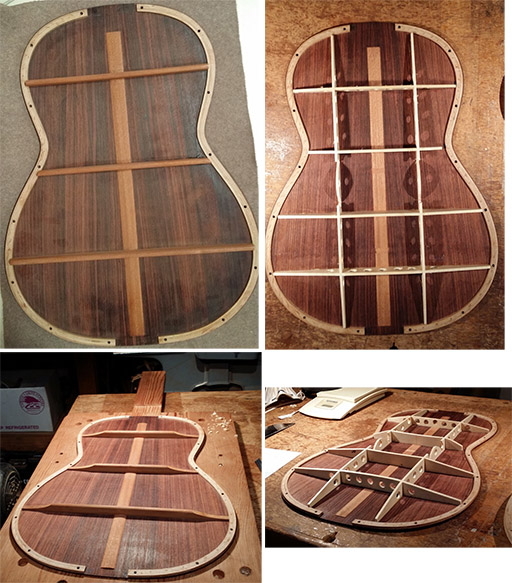
The experiment consisted of 4 (2 pairs of) back plates with the thickness of 2.2mm and 2.9mm.
Type of wood:
Back plate: Rosewood (Dalbergia latifolia)
Back struts: Mahogany (Swietenia macrophylla) and Spruce (Picea abies)
Bracing systems:
Sides
The experiment consisted of 4 pairs of sides. Two with a thickness of 1.4mm and two laminated sides with a total thickness of 2.7mm. The thick sides were also reinforced with ebony and equipped with closable sound ports.
Type of wood:
Sides: Rosewood (Dalbergia latifolia)
Neck- and tailpiece: Mahogany (Swietenia macrophylla)

Neck & Strings
The experiment consisted of 4 "identical" necks and the strings used were D'Addario Hard Tension Nylon strings.
Type of wood:
Neck: Mahogany (Swietenia macrophylla)
Fretboard: Ebony (Diospyros crassiflora)
The measurement setup
We needed to find a method to standardise the measurements to get comparable results which also were repeatable. This was done both when generating the input to the guitar but also when recording the output.
Getting a frequency response from an acoustic system is basically done by using all frequencies as an input, measuring the response and performing a Fourier transform.
This can be done in three ways;
- Swiping all frequencies
- Using a broadband noise
- Using a dirac pulse
We found the dirac pulse to be the most correct way due to the impact of transfer functions in other input systems.
I am not going to explain the physics but what you need to know is when using a very short pulse as an input to a system you are actually putting energy in all frequencies and the system will respond with it's acoustic behaviour, i.e. the frequency response. The frequency response tells you how different frequencies pass the system, or in this case, the guitar's amplification for every frequency. In a complex non static system ,as the guitar, a frequency response is not able to describe the complete acoustic behaviour. However, it can tell us many important main characteristics.
Practically, how do we enter a dirac pulse into the guitar? It is easier than it sounds. When using your knuckles and knock the guitar you are are actually creating a quite perfect dirac pulse, i.e the guitar will respond with it's transfer function. Equally, when you clap your hands in a room the room will answer with it's frequency response. The physics of acoustics is pretty beautiful. You give the system a knock, asking how it works, and it immediately respond with a great description of itself :smirk:
We now needed to make a tool that repeatedly could knock the guitar with the same force every time. This was done with help of a pendulum and the gravity. The pendulum was made of a plastic ball, some wood, a rod, and then mounted on microphone stand. See image below.

To the inquisitive; the energy entering the guitar in each pulse was approximately 58mJ.
Greg had made a wooden construction to hang the guitar and position the recording microphone on the same distance for every measurement. The impulse response was measured at a distance of 1m from the guitar and 0.8m above the floor. The guitar bottom was placed about 0.59m above the floor. Measurements were made both inside and outside to compare the impact of room reflections.

For the top plate measurements the Pendulum was positioned to hit the bridge bone saddle from the bass to the treble side. For each construction combination the peak average of ten different saddle positions was measured.
For the back plate, the pendulum was positioned at three different spots (see image below). Each spot was hit three times starting with the middle of the lower bout, the down right of the lower bout and at last the right of the upper bout.

The equipment used was:
- An omnidirectional microphone; Earthworks QTC 1 with the sensitivity: 30mV/Pa (-30.5dBV/Pa)
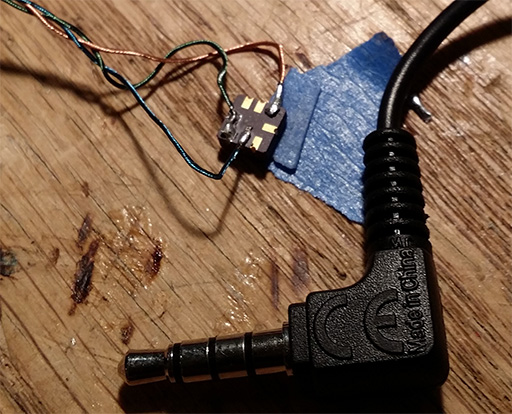
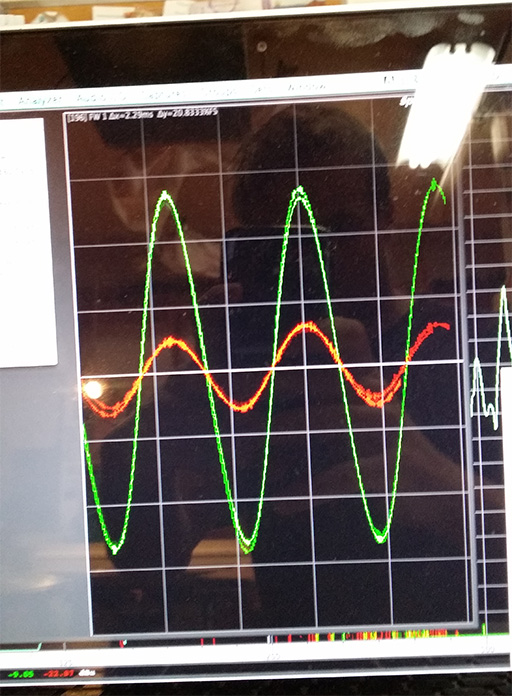
- Two wide bandwidth accelerometers (ADXL001)
- A specially designed circuit to power and filter the accelerometer signals. See below.
- A "hand"(drill)-wired coil on a ferrite rod.
- A rigid camera tripod
- Some light weighted neodymium magnets.
- An audio interface; Metric Halo ULN-2. The the gain for the ULN-2 for all measurements were 6dB. The trim and the trim link was disabled and TRS enabled
- The audio softwares; SpectraFoo Complex, Audacity and Pro Tools.
Modal Analysis -
When studying the vibrational pattern that arises on different resonance frequencies we entitle this as Modal analysis. Each vibrational behaviour/pattern is called a Mode. There are multiple ways to visualise these patterns and I will go through a couple of them and especially the method we used in this project.
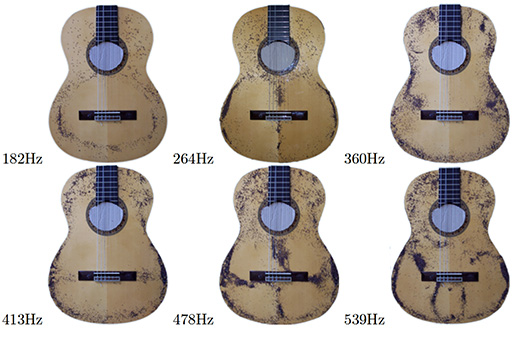
-Chladni pattern/figures
Chladni figures is named after the german physicist Ernst Chladni. In the 18th century he described a method to visualise the vibrational patterns with sand on a metal plate using a violin bow. When drawing the bow on the metal plate the sand bounced from areas of great vibrations to areas of no vibrations, so kalled nodal lines.
Today many luthiers use a loudspeaker driven by a signal generator to get the guitar to resonate. Another way is to use a coil and a magnet which I will describe later on.
In this project we did not focus on "standard" Chladni patterns but as a reference, I will add an image on some chladni patterns I have done earlier with some nice earl grey tea. :tea:
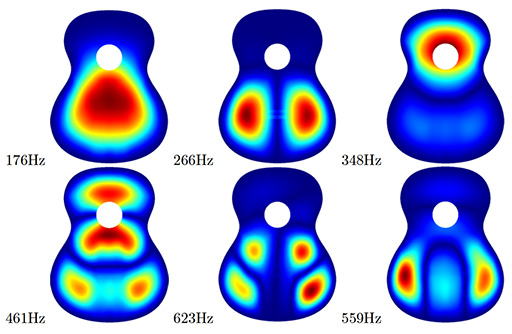
-FEM analysis
-Our approach
....
This text will be updated continuously during July 2017 ....
We really appreciate comments, feedback and questions!


